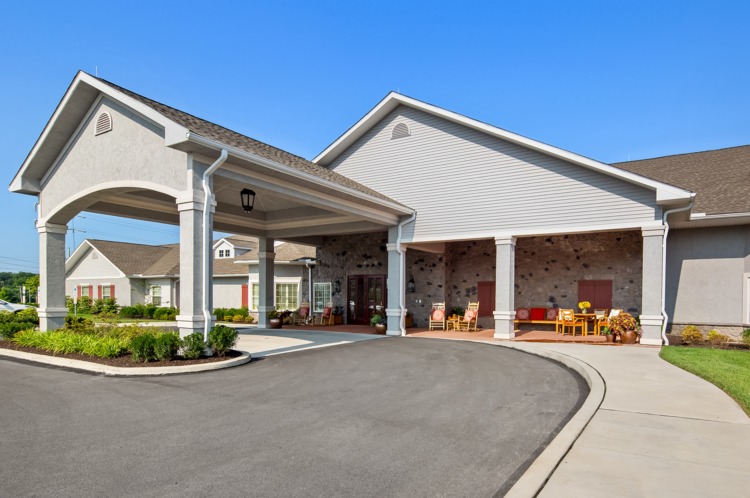
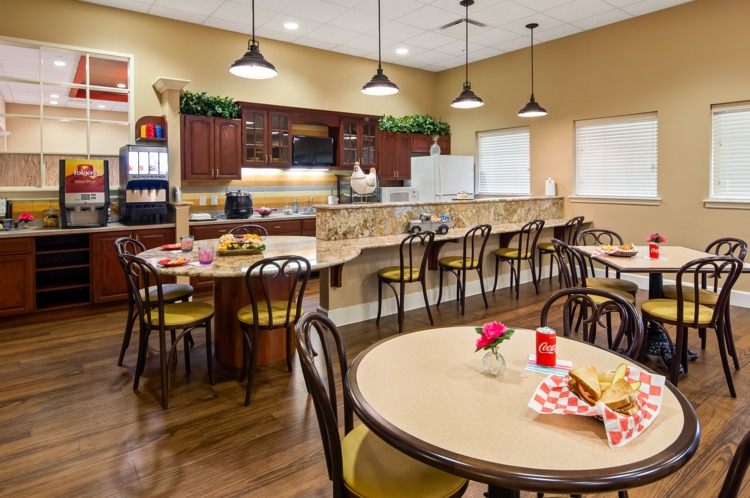
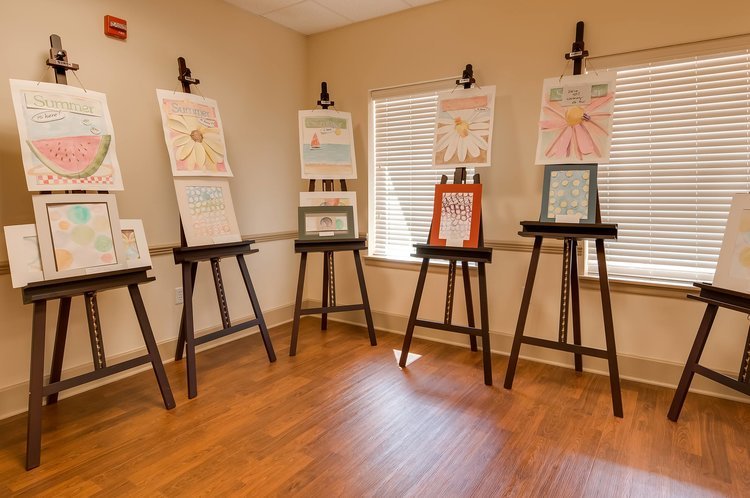
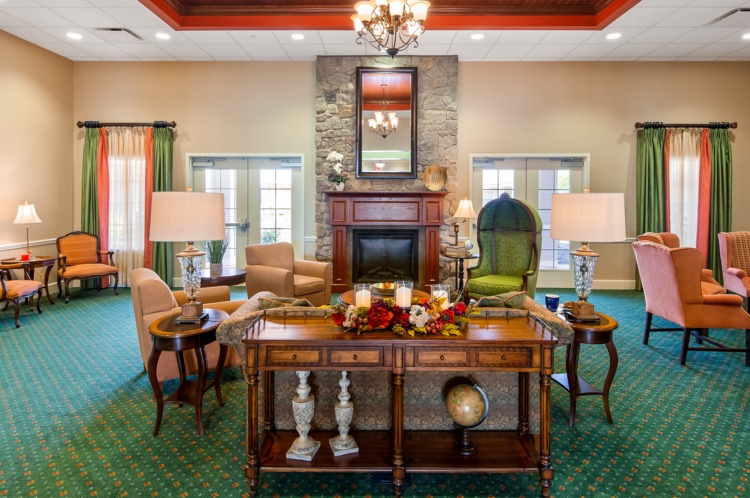
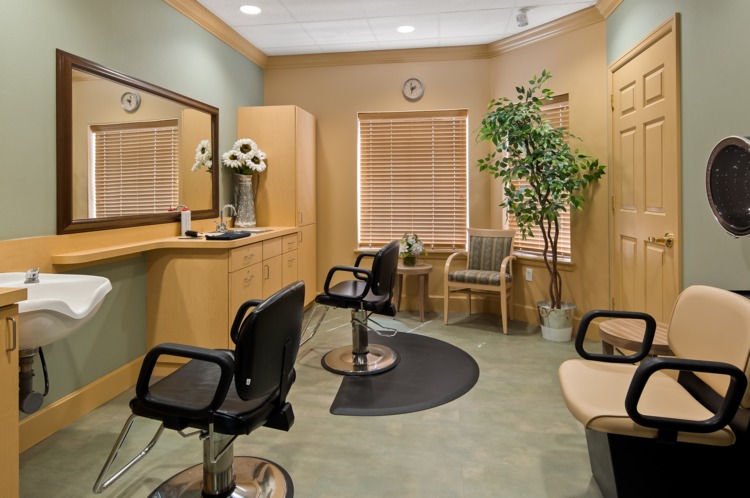
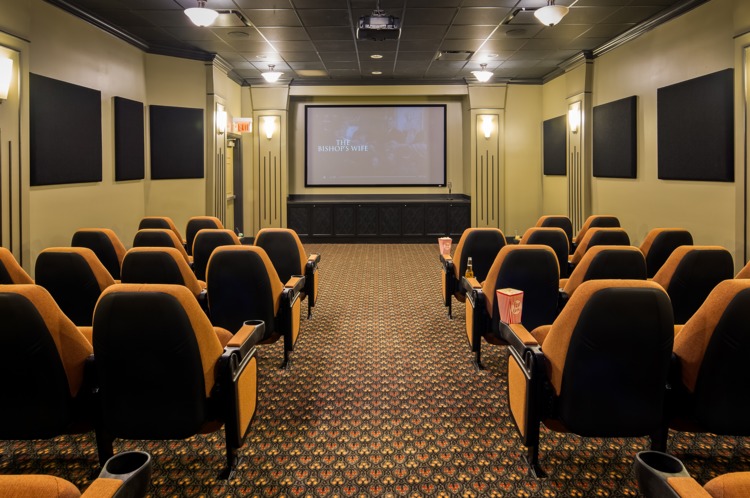
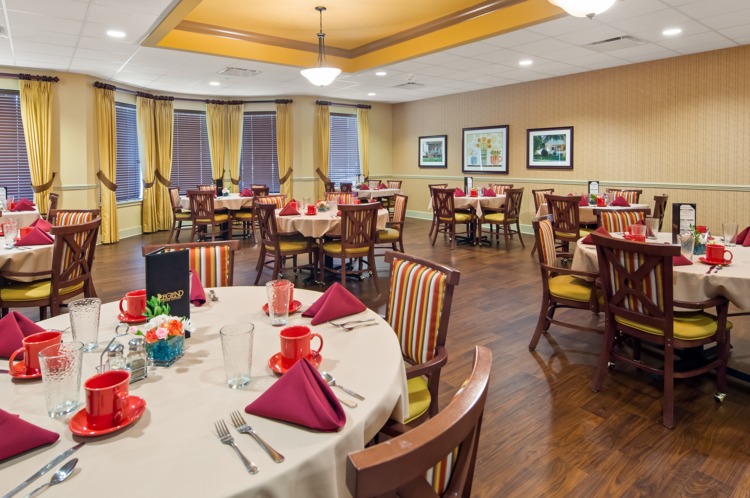
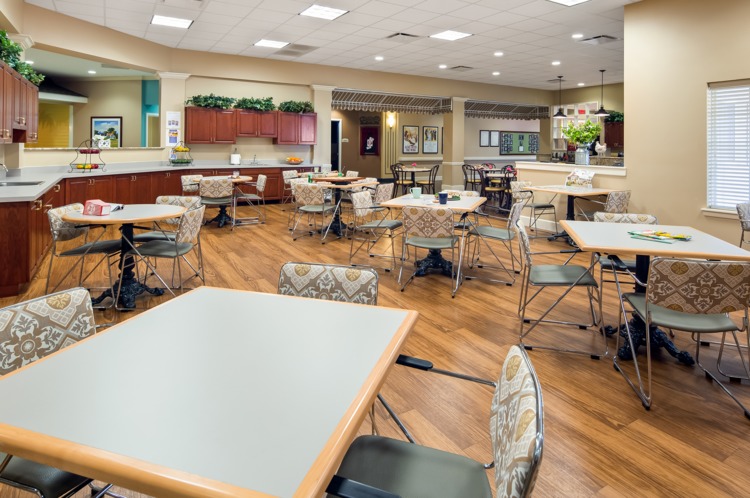
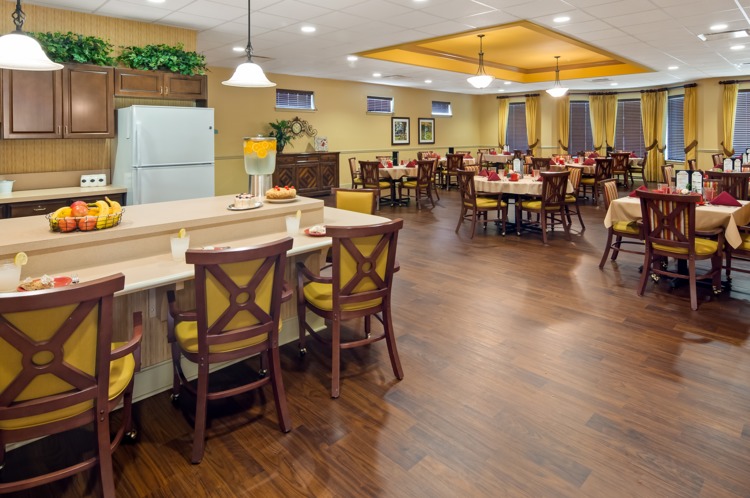
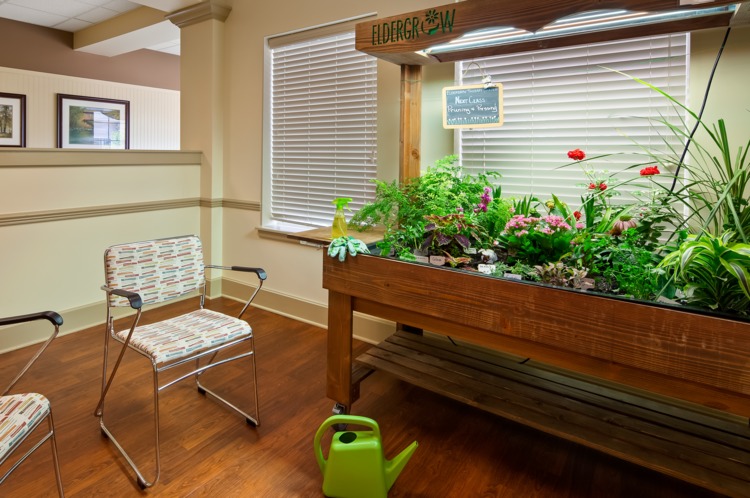
Overview
Overview
Care Types: Assisted Living, Alzheimer's Care
Welcome!
About This Company
Legend of Allentown
Services/Activities
24-Hour Awake Staff
Activities Onsite
Devotional Services Offsite
Indoor Common Areas
Meals Provided
Property Can Monitor Blood Sugar for Pill Dosage
Self Management
Standby
Floor Plans
Suite

0 Bed
1 Bath
265 Sqft
Delux Suite

0 Bed
1 Bath
345 Sqft
Shared Suites K & L

0 Bed
1 Bath
365 Sqft
Shared Suite

0 Bed
1 Bath
385 Sqft
Cypress

1 Bed
1 Bath
410 Sqft
Dogwood

1 Bed
1 Bath
416 Sqft
Maple

1 Bed
1 Bath
425 Sqft
Aspen

1 Bed
1 Bath
430 Sqft
Oak

1 Bed
1 Bath
430 Sqft
Spruce

1 Bed
1 Bath
610 Sqft
Hemlock

2 Bed
1 Bath
755 Sqft
*Prices listed are based on availability and subject to change.
Neighborhood & Demographics
Walk Score ® 57
(Somewhat Walkable)
WHAT IS A WALKSCORE?
Walk Score measures how walkable an
address is based on the distance to
nearby amenities.
Learn how it works
See detailed Walk Score rating
WHAT IS A WALKSCORE?
Walk Score measures how walkable an
address is based on the distance to
nearby amenities.
Learn how it works
See detailed Walk Score rating
WHAT IS A TRANSIT SCORE?
Transit Score measures how well a location
is served by public transportation.
Learn how it works
See detailed Transit Score rating
DEMOGRAPHIC BREAKDOWN
Marital Status
Community
Commute
Highest Level of Education
Population by Age
Males by Age Distribution
Females by Age Distribution
Adult vs. Children
Men / Women 55+ Distribution
Population by Age
Status | Percentage |
---|---|
0-9 | 11% |
10-19 | 13% |
20-29 | 13% |
30-39 | 12% |
40-49 | 13% |
50-59 | 15% |
60-69 | 12% |
70-79 | 7% |
80 Above | 5% |
Adult vs. Children
Status | Percentage |
---|---|
Children | 25% |
Adult | 75% |
Men / Women 55+ Distribution
Status | Percentage |
---|---|
55+ Men | 46% |
55+ Women | 54% |
Community
Status | Percentage |
---|---|
Married Couples | 44% |
Single Females | 11% |
Single Males | 4% |
Living Alone | 11% |
Living With Family | 29% |
Commute
Status | Percentage |
---|---|
Drove By Themselves | 76% |
Public Transportation | 6% |
Carpooled | 9% |
Walked | 4% |
Occasional Drive | 0% |
Work At Home | 4% |
Other | 1% |
Highest Level of Education
Status | Percentage |
---|---|
Below 9th Grade | 3% |
Bachelors Degree | 18% |
High School | 36% |
College | 16% |
Associate Degree | 8% |
9th to 12th Grade | 7% |
Graduate | 12% |
Marital Status
Status | Percentage |
---|---|
Single | 34% |
Married (Not Separated) | 48% |
Separated | 2% |
Widowed | 7% |
Divorced | 10% |
Males Age Distribution
Status | Percentage |
---|---|
0-9 | 11% |
10-19 | 12% |
20-29 | 13% |
30-39 | 11% |
40-49 | 12% |
50-59 | 14% |
60-69 | 11% |
70-79 | 13% |
80 Above | 3% |
Females Age Distribution
Status | Percentage |
---|---|
0-9 | 10% |
10-19 | 11% |
20-29 | 12% |
30-39 | 11% |
40-49 | 12% |
50-59 | 14% |
60-69 | 12% |
70-79 | 13% |
80 Above | 6% |